A guide on best crypto trading indicators for beginners.
Cryptocurrency trading is a risky business. There is constant unpredictability attached to every investment. Some people come out successful with a stroke of luck. However, if you are one of those who believe in ‘making their own luck’ then crypto trading indicators are for you. They give you an analysis of the market prior to making an investment. This helps in speculating the future of investment. Here we are going to describe the best crypto indicators and how you can use them in technical analysis of the market.
Table of Contents
What are Crypto Trading Indicators?
Cryptocurrency markets are in infancy. There is less number of people trading crypto asset in comparison to other asset classes. Consequently, the slightest change in buying and selling can hugely impact the overall price movements. The crypto markets are notoriously volatile as a result. In this scenario, crypto traders welcome any sort of information which tells them what to expect. That’s where the indicators come in. Using indicators may sound like a difficult task if you are a beginner. Nonetheless, over time you can master the art of technical analysis and reading charts. This helps in efficient and profitable trading operations.
Another advice for traders is that don’t rely on other people’s analysis. Many novice traders fall into this rabbit hole of running after expert traders (or people on the internet who seem like expect traders) for guidance. It may occasionally be a good practice. However, totally relying on somebody can be devastating for your portfolio. You know your strengths and weaknesses. So make your own judgment with the help of best trading setup.
Here is what trading indicators tell you:
- Crypto Buy Indicator: Indicators highlight the points at which you should buy specific currency. Besides, with analysis, you can know when is the time for buying.
- Crypto Sell Indicator: Indicators also help in guiding which point is right for selling a particular asset.
In subsequent paragraphs, we have succinctly described the best crypto trading indicators.
RSI (Relative Strength Index):
Relative Strength Index is a simple crypto indicator. It measures the speed at which price changes are happening. As a technical indicator, RSI deciphers the strength or weakness of an asset. It measures a coin’s recent price changes. The comparison is drawn between the recent closing price and the previous closing price. This leads to the eventual identification of future prices.
RSI trading indicator is oscillatory in nature. It fluctuates between 0 to 100 points. The value guides traders on whether to buy or sell a cryptocurrency. When the index goes below 30 points this signals that the asset is oversold, so it is a high time to buy because prices are down and will likely go up in the future. On the other hand, 70 points or above indicates that the asset is overbought so it’s the right time to sell as prices are high at the moment and will likely go down when a good number of traders will start accumulating. The time frame of evaluation is generally 14 days but can be re-adjusted for a longer period of time.

RSI is the most useful indicator for traders in the cryptocurrency market. You can identify ideal entry and exit point zones with RSI. It is uncomplicated and gives clear direction with promising outcomes.
MACD (Moving Average Convergence Divergence):
The basis of MACD indicator is the exponential moving average. It combines the properties of both an indicator and an oscillator. MACD guides traders on exit and trading points. This indicator turns two moving averages into a decision point Price Momentum Oscillator (PMO) by subtracting moving averages from each other.
MACD trading indicator is all about convergence and divergence of two moving averages. When moving averages are going away from one another then divergence is happening. Similarly, when two moving averages are getting closer to meet at one point then convergence is taking place. The points of crossing determine the change in the overall trend.

This indicator fluctuates up and down the centerline. In order to gain an advantage from this indicator, pay attention to the position and movement. When an indicator is above the zero lines then the price of a cryptocurrency is increasing and when it is below then the price is decreasing. It is high time to buy a currency when you view a positive divergence. Negative divergence points towards the selling of the asset.
SMA (Simple Moving Average):
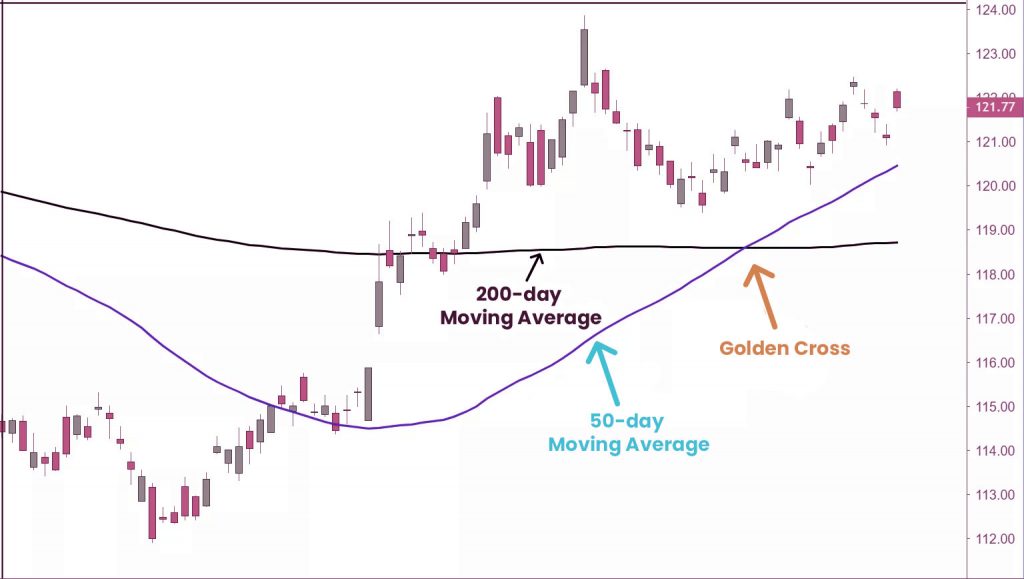
Simple Moving Average (SMA) is also among our list of best crypto trading indicators. This indicator shows the price of an asset over time. Simple Moving Average is calculated by the addition of closing prices and then dividing that by the time period. SMA is of importance to crypto traders because it helps in the understanding of future trends and avenues of investment.
The Golden Cross (where the short-term average is crossing over the long-term average) is an indicator of an upward trend. You can also adjust the short-term and long term averages in your desired time frame.

SMA is from the same family as MACD. Both of them work through moving averages of an asset to show future developments.
Bollinger Bands:
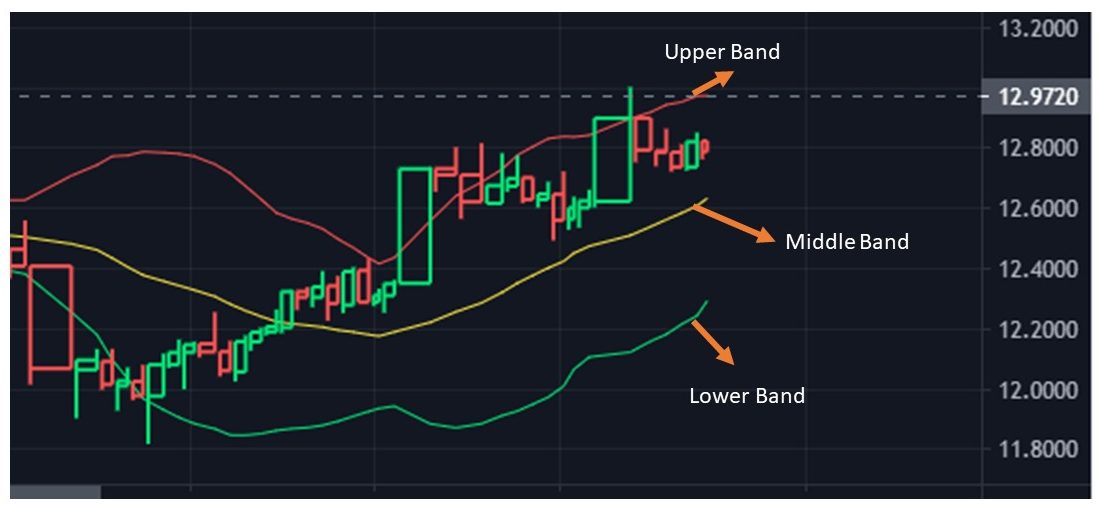
Bollinger bands are also a useful market indicator for technical analysis. They are represented by an upper band and a lower band. In between these bands is a simple moving average indicating the price difference of an asset over time.
Bollinger bands measure the oscillation and depict the low or high volatility in addition to oversold or overbought conditions.

When the volatility of an asset is high in the market then the upper and lower bands are widened. In the case of settlement of the market, the bands become thin. The middle line is set at a 20-day Simple Moving Average (SMA). If you see the price of a cryptocurrency go beyond MA and exceed the upper band then the coin is overbought. If it is striking the upper band but not breaking through then you just found the resistance zone. The oversold market moves in the opposite direction and reaches below the lower band. If it hits the lower Bollinger band but does not go down that point then the rea is a support zone.
Importance of Support and Resistance Zone:
Expert cryptocurrency traders try hard to find support and resistance zone. Support and resistance are important for crypto trading because:
- Big players and whales of the crypto market who can cause the price movement, use S&R for technical analysis.
- Key for understanding the path of price.
- Appear on all tools and in all time frames.
Conclusion: Crypto Indicators
Like we mentioned at the start, trading indicators give you a chance to make your own luck. They provide you with the necessary information regarding future developments. You will have a broader perspective regarding investments and trading with the help of these best crypto trading indicators according to our listing.
For learning more about cryptocurrency trading, join our free course. Sign up here and take your trading game to the next level.
Follow our blog for more discussions on cryptocurrency trading.
